
Debugging RT-Smart Using CKLINK and GDB#
This article describes how to use CKLINK, XuanTie DebugServer, and GDB to debug K230 RT-Smart, including kernel debugging and user-space ELF program debugging.
This article assumes:
The SDK has been configured and compiled.
The development board can boot RT-Smart normally.
On-board commands are executed through a serial terminal.
Commands are executed in the SDK root directory.
Debugging Chain#
The debugging chain consists of four components:
GDB <---- TCP/IP ----> XuanTie DebugServer <---- USB ----> CKLINK <---- JTAG ----> K230
Each component serves the following purpose:
CKLINK connects to the K230 via JTAG.
XuanTie DebugServer runs on the PC, connects to CKLINK, and provides a debugging port to GDB.
GDB runs on the PC or development machine and connects to DebugServer via
target remote.The serial terminal is used to view RT-Smart logs and launch user-space programs on the board.
The same GDB connection is used to debug the kernel and user-space programs. The difference is that the kernel ELF itself contains symbol information; user-space programs require an additional ELF compiled with symbol information, which must be manually loaded in GDB.
Hardware Setup#
Connecting the Serial Terminal#
The serial terminal is used to view boot logs and execute on-board commands. Common serial parameters are:
115200 8N1
Refer to the documentation for the specific development board for the serial port number, baud rate, and wiring configuration.
Connecting CKLINK#
The following JTAG signals generally need to be connected:
CKLINK        K230 开发板
------        ----------
VTREF/VREF -> 目标板 IO 电平参考
GND        -> GND
TCK        -> JTAG_TCK
TMS        -> JTAG_TMS
TDI        -> JTAG_TDI
TDO        -> JTAG_TDO
nTRST      -> JTAG_TRST
nSRST      -> RESET,可选
Precautions:
CKLINK and the development board must share a common ground.
VTREF/VREFis a level reference and must not be used as a power supply for the development board.The JTAG voltage level must match the development board’s IO voltage level.
The development board firmware must configure the JTAG-related IOs for the JTAG iomux. The 01 Studio firmware is configured for this by default.
If the connection is unstable, first check the wiring, power supply, and common ground.
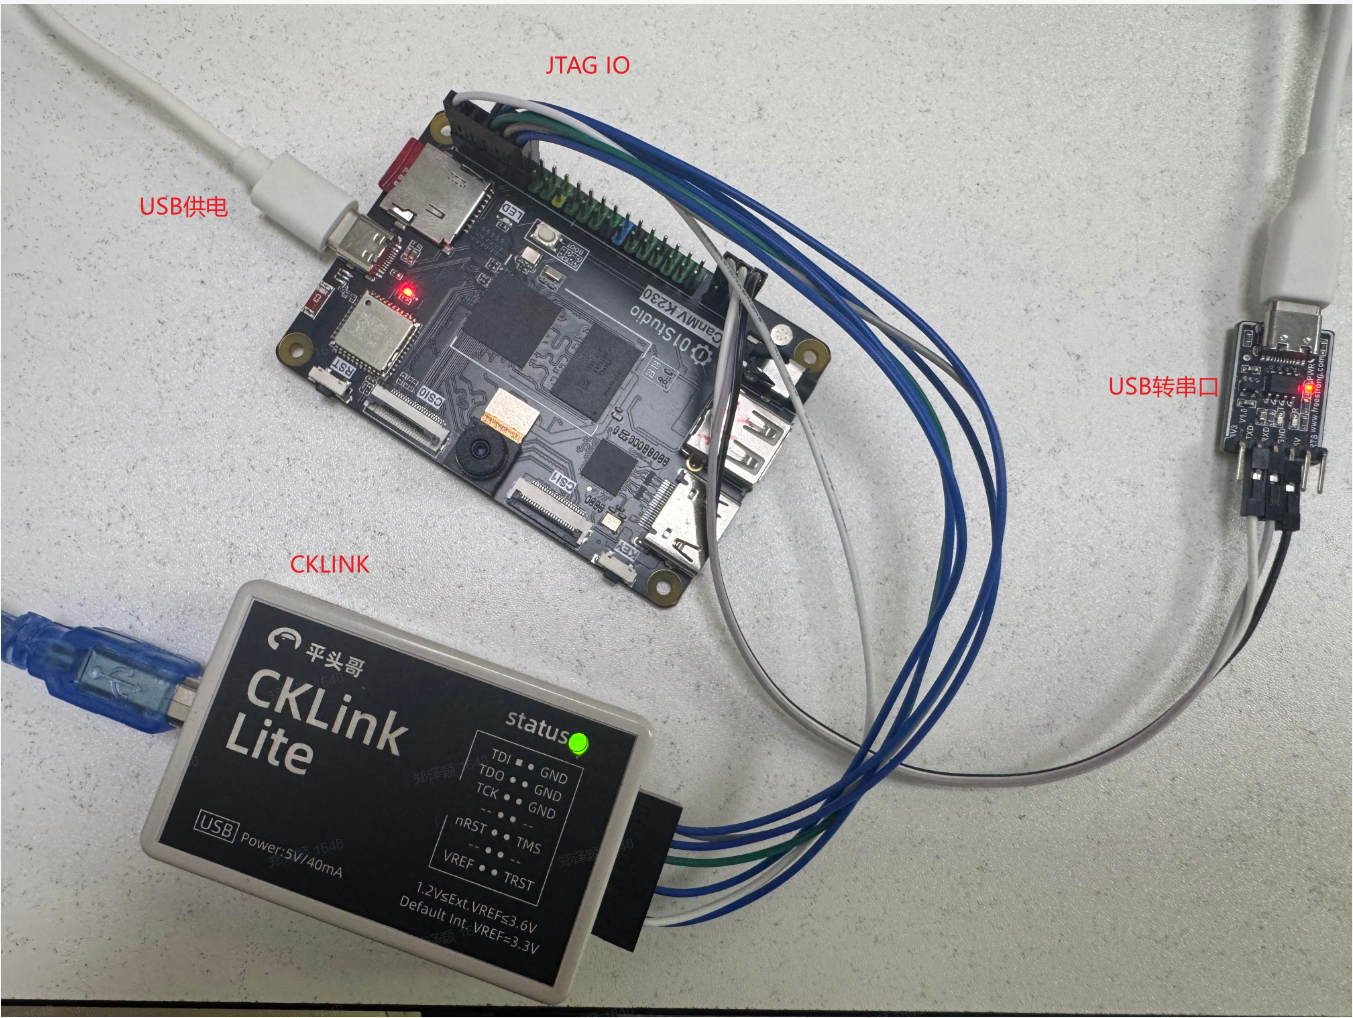
The following figure uses the 01 Studio development board as an example to show how to connect CKLINK to the development board. The JTAG header positions and silkscreen labels may differ between development boards. For actual connections, refer to the development board schematic and hardware manual.
Preparing DebugServer#
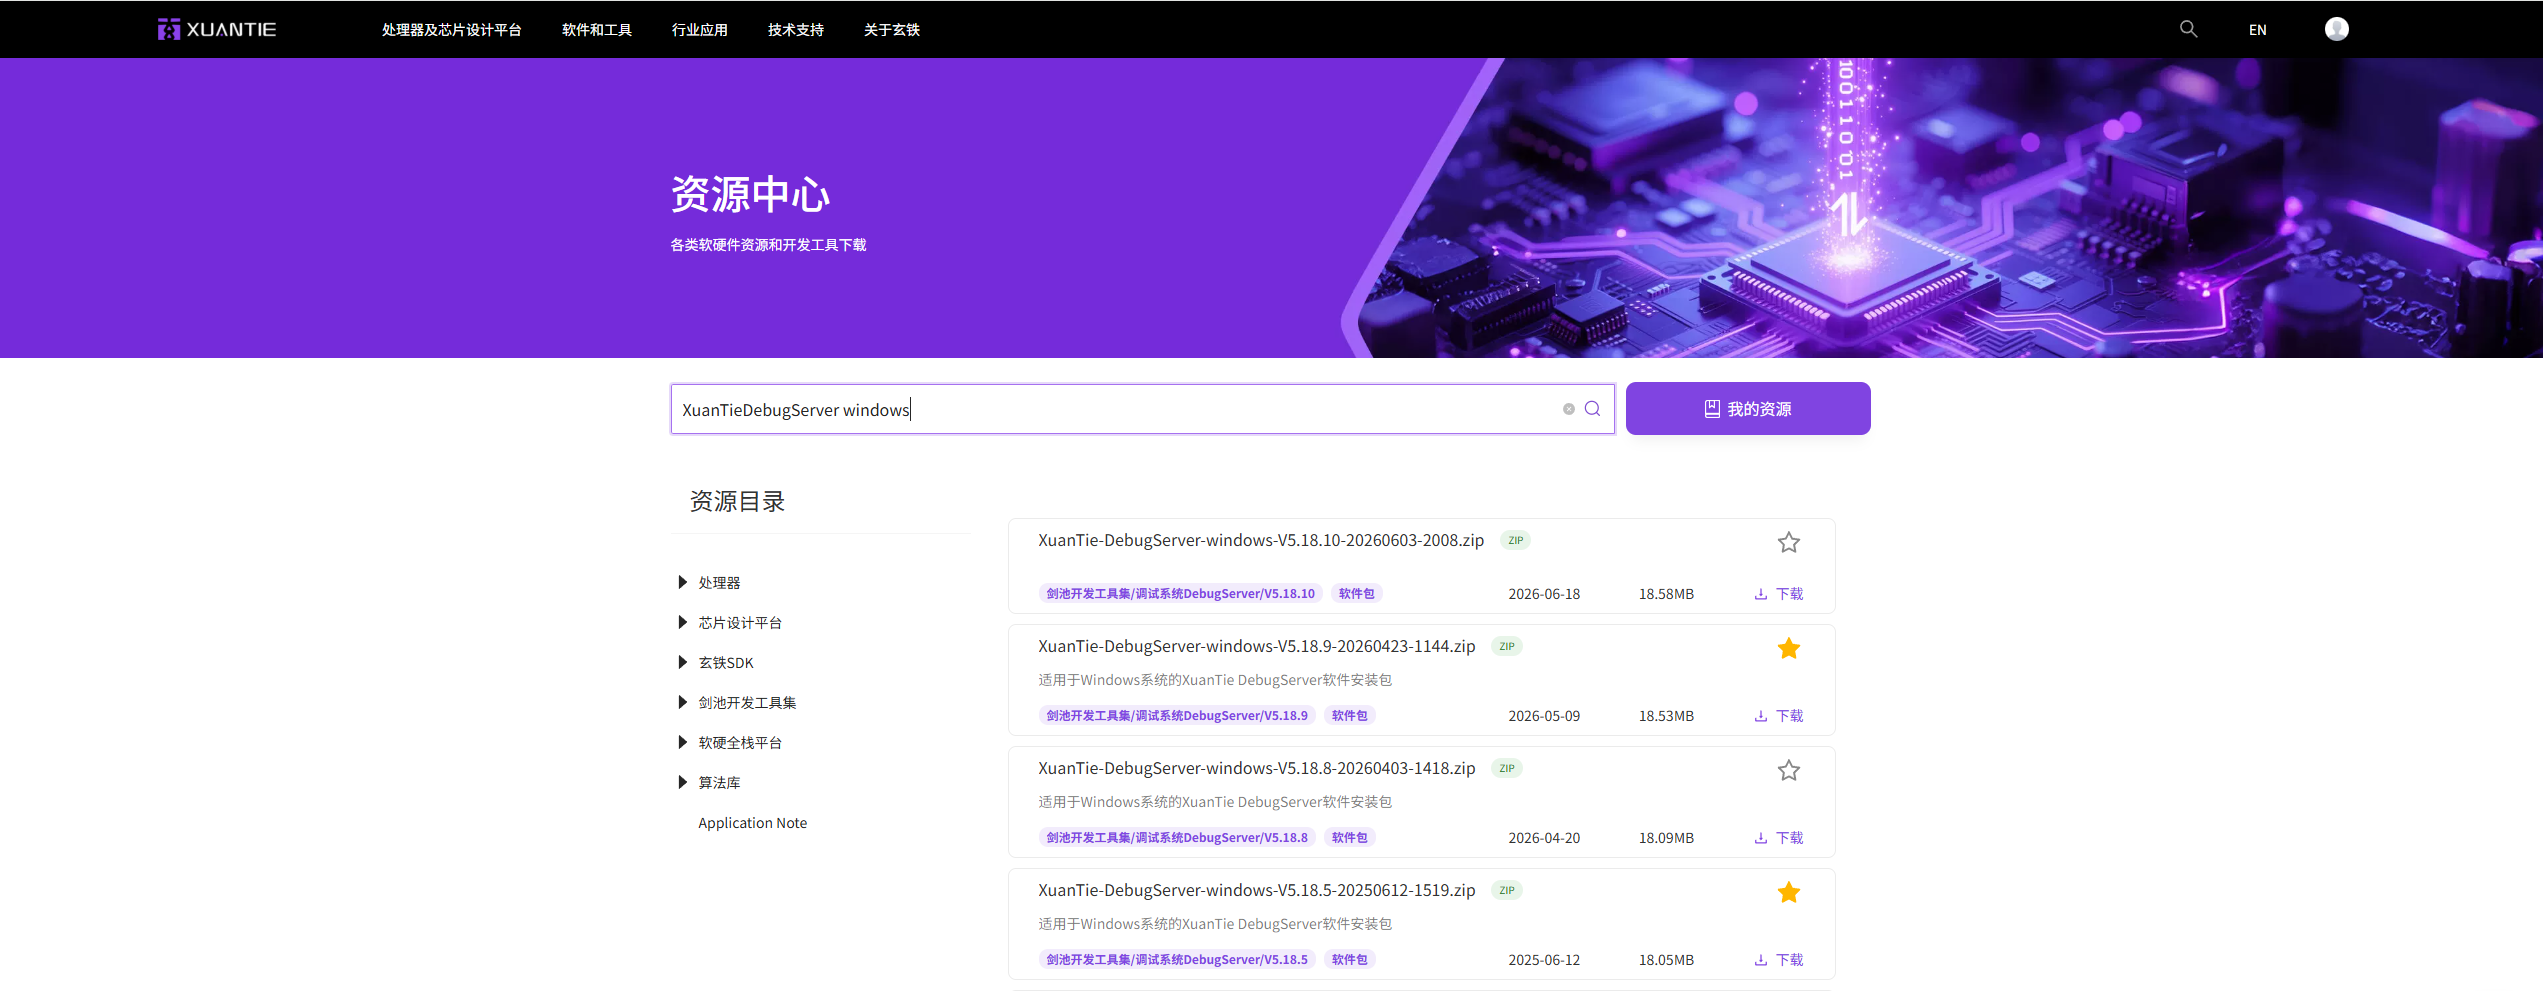
If XuanTie DebugServer is not yet installed on the PC, you can obtain it from the XuanTie community download page. DebugServer also provides a Linux version, but this document only covers the Windows version and does not elaborate on Linux usage. The figure below only illustrates the download entry point; the actual page layout may vary depending on the version.
Download URL:
After installation, launch XuanTie DebugServer on Windows and start the GDB Server service via Control --> RunDebuggerServer. This document does not elaborate on the specific operations in the DebugServer GUI.
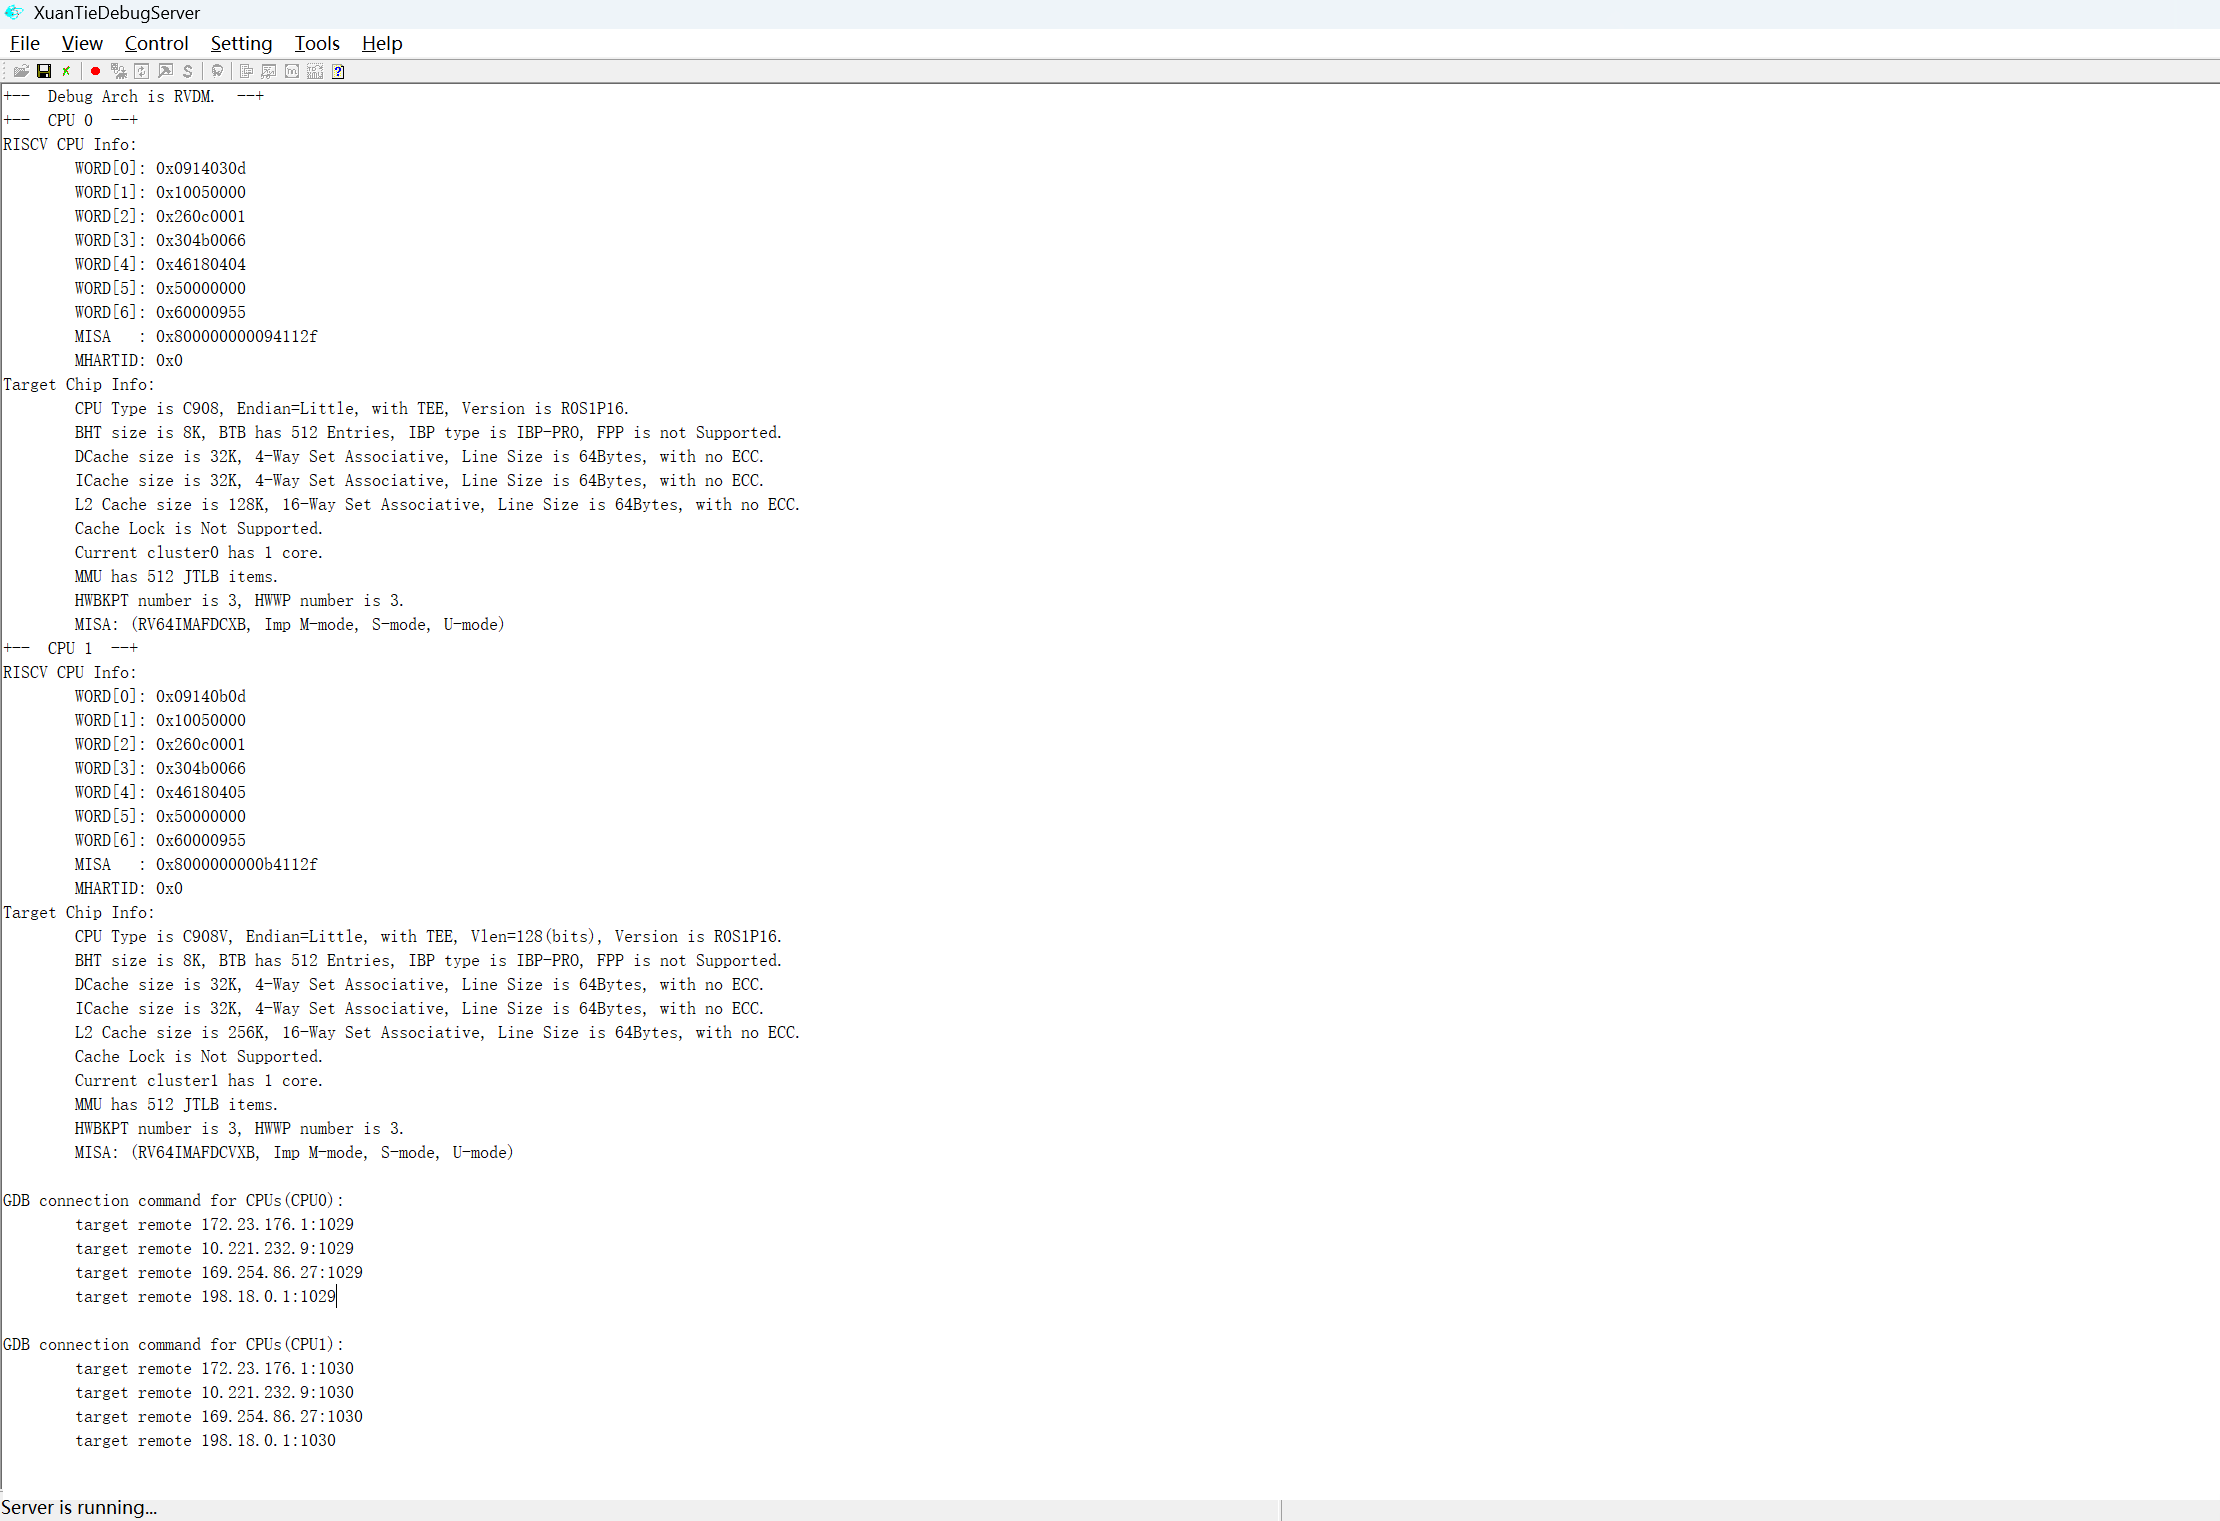
After GDB Server starts, you need to record two pieces of information:
The IP address of the PC where DebugServer is located. The example below uses
172.23.176.1.The GDB port displayed by DebugServer. The example below uses
1030.
The figure below shows the state after DebugServer starts. When subsequently connecting with GDB, use the corresponding IP address and port number shown in the figure.
In the subsequent commands:
<DEBUGSERVER_IP> represents the IP address of the PC running DebugServer, for example: 172.23.176.1
<GDB_PORT>       represents the GDB port displayed by DebugServer, for example: 1030, subject to the actual display
Preparing Symbol Files#
Kernel Symbol File#
The RT-Smart kernel ELF contains symbol information by default. After the build is completed, the file is usually located at:
src/rtsmart/rtsmart/kernel/bsp/maix3/rtthread.elf
When debugging the kernel, GDB directly loads this file.
User-space Program Symbol File#
User-space programs must be compiled separately into ELF files that contain debugging information and have not been stripped. The ELF file running on the board and the ELF file loaded by GDB on the PC must be from the same build.
We recommend using the following debug compilation options for user-space programs:
-Og -g3 -gdwarf-4 -fno-omit-frame-pointer
Do not run strip after linking is completed.
Taking the timer example as an example:
PC 端符号文件:src/rtsmart/examples/elf/peripheral/timer.elf
板端运行文件:/sdcard/app/examples/peripheral/timer.elf
You can use the following command to check whether the ELF file contains debugging information:
readelf -S src/rtsmart/examples/elf/peripheral/timer.elf | grep debug
If there is no output, the ELF file does not contain debugging information and must be recompiled.
Starting GDB#
It is recommended to use the RISC-V GDB included with the SDK. This GDB matches the SDK toolchain, RISC-V architecture, and DebugServer remote debugging protocol, making it the preferred default.
The default /usr/bin/gdb installed on Ubuntu is usually a native x86_64 GDB. It cannot be used directly to debug RISC-V targets and may fail to recognize RISC-V ELF files or properly handle target register descriptions after connecting to DebugServer. If you need to use a system package, use gdb-multiarch, which supports RISC-V. However, the commands below still use the RISC-V GDB included with the SDK.
Run the following commands in the SDK root directory to start the RISC-V GDB provided by the SDK and load the kernel symbols:
~/.kendryte/k230_toolchains/riscv64-linux-musleabi_for_x86_64-pc-linux-gnu/bin/riscv64-unknown-linux-musl-gdb \
    src/rtsmart/rtsmart/kernel/bsp/maix3/rtthread.elf
If the toolchain installation path differs, replace the GDB path in the command with the actual path.
After GDB starts, connect to DebugServer:
target remote <DEBUGSERVER_IP>:<GDB_PORT>
Example:
target remote 172.23.176.1:1030
After the connection succeeds, GDB will stop at the target’s current execution location. At this point, you can debug the kernel.
Debugging the Kernel#
The kernel symbols have already been loaded along with rtthread.elf, so you can set breakpoints on kernel functions directly.
For example:
b rt_thread_startup
c
Common commands:
bt
info registers
n
s
p variable_name
Descriptions:
bsets a normal software breakpoint.ccontinues execution.btdisplays the call stack.nsteps through execution without entering functions.ssteps through execution and enters functions.
You can usually use break directly in kernel code. If software breakpoints fail at certain locations, you can use a hardware breakpoint instead:
hbreak function_name
Debugging a User-Space ELF Program#
Symbols for user-space programs are not automatically loaded with the kernel ELF. You need to execute add-symbol-file separately in the same GDB session.
Using the timer example, load the user-space ELF symbols:
add-symbol-file src/rtsmart/examples/elf/peripheral/timer.elf 0x200000000
0x200000000 is the virtual load address of the current RT-Smart user-space ELF. Enter the virtual address at which the user-space program runs, not the physical address.
Then set a hardware breakpoint on a user-space function:
hbreak test_hard_timer
c
Run the user-space program in the serial terminal:
/sdcard/app/examples/peripheral/timer.elf
After the program reaches the breakpoint, GDB will stop. You can then inspect the call stack, variables, and source location:
bt
n
p ret
p/x ret
If you want the program to stop as soon as it enters user-space ELF code, you can set a one-time hardware breakpoint at the entry address:
thbreak *0x200000000
c
Summary of Common Commands#
Connect to DebugServer:
target remote <DEBUGSERVER_IP>:<GDB_PORT>
Kernel breakpoints:
b rt_thread_startup
hbreak function_name
Load user-space ELF symbols:
add-symbol-file src/rtsmart/examples/elf/peripheral/timer.elf 0x200000000
User-space breakpoints:
hbreak test_hard_timer
thbreak *0x200000000
Execution and stepping:
c
n
s
View information:
bt
info registers
p variable_name
p/x variable_name
Common Issues#
Why Is hbreak Recommended for User-Space Programs?#
break is a software breakpoint and requires GDB to modify target memory. A software breakpoint may fail when the user-space ELF has not yet been loaded, the user page tables have not yet been switched, or the code pages are not writable.
hbreak is a hardware breakpoint, and the CPU debug trigger compares the PC address. When debugging user-space programs, it is recommended to use hbreak or thbreak first.
Why Are User-Space Breakpoint Addresses Virtual Addresses?#
While a user-space program is executing, the PC contains a user virtual address. Hardware breakpoints compare the executing PC, so a user-space virtual address, such as 0x200000000, should be used.
DWARF Error When Printing Local Variables#
If GDB reports a similar error when printing a local variable:
dwarf2_find_location_expression: Corrupted DWARF expression.
This is usually caused by GDB’s poor compatibility with the DWARF debug information in the current ELF. It is recommended to recompile the user-space program with -gdwarf-4.
User-Space Breakpoint Does Not Trigger#
Check the following in order:
Whether the ELF running on the board and the ELF whose symbols are loaded on the PC are from the same build.
Whether the user-space ELF has not been stripped and contains debug information.
Whether
add-symbol-file ... 0x200000000has been executed.Whether
hbreakwas used.Whether the target program has already been run in the serial terminal.
Recommended Workflow#
The complete workflow is as follows:
Connect the CKLINK JTAG.
Connect the serial terminal.
Start the development board.
Launch XuanTie DebugServer and GDB Server on Windows.
Record the DebugServer IP address and GDB port.
Start GDB and load
rtthread.elf.GDB executes
target remote <DEBUGSERVER_IP>:<GDB_PORT>.When debugging the kernel, set breakpoints directly on kernel functions.
When debugging a user-space program, first use
add-symbol-fileto load the user-space ELF symbols.Use
hbreakto set user-space breakpoints.Run the user-space program in the serial terminal.
After GDB hits the breakpoint, begin single-stepping, inspecting variables, and viewing the call stack.
RT-Smart Debugging Considerations#
Do not power off CPU0’s power domain during debugging, and do not disable SYSCTL_CLK_CPU_0_PCLK.
For example, in src/rtsmart/rtsmart/kernel/bsp/maix3/app_canmv/main.c, if there is code like the following, it should be disabled during debugging:
sysctl_pwr_off(SYSCTL_PD_CPU0);
If only some of CPU0’s clocks are disabled to reduce CPU0’s power consumption, SYSCTL_CLK_CPU_0_PCLK must be retained. Disabling this clock prevents DebugServer from accessing the RISC-V Debug Module. A common error is as follows:
WARNING: Can not access a Debug Module with base address 0x0.
At this point, DebugServer cannot continue detecting CPU1, and GDB cannot connect to the target normally.